About Transpetro
Integrating all in one platform
Integrating all in one platform
The goal of Transpetro is to be the best transport and logistics company for clients in the oil, gas, and biofuels industry in Brazil, generating value with safety, respect for people and the environment.
They are responsible for the storage and transport of oil and derivatives, biofuels, and natural gas to the most remote points of Brazil.
One of Transpetro's most significant challenges was to unify information from different sources and get a complete view of everything that is happening instantly into three main areas: planning, operation, and monitoring.
How to coordinate all the activities that are currently carried out with great effort and a low level of information integration?
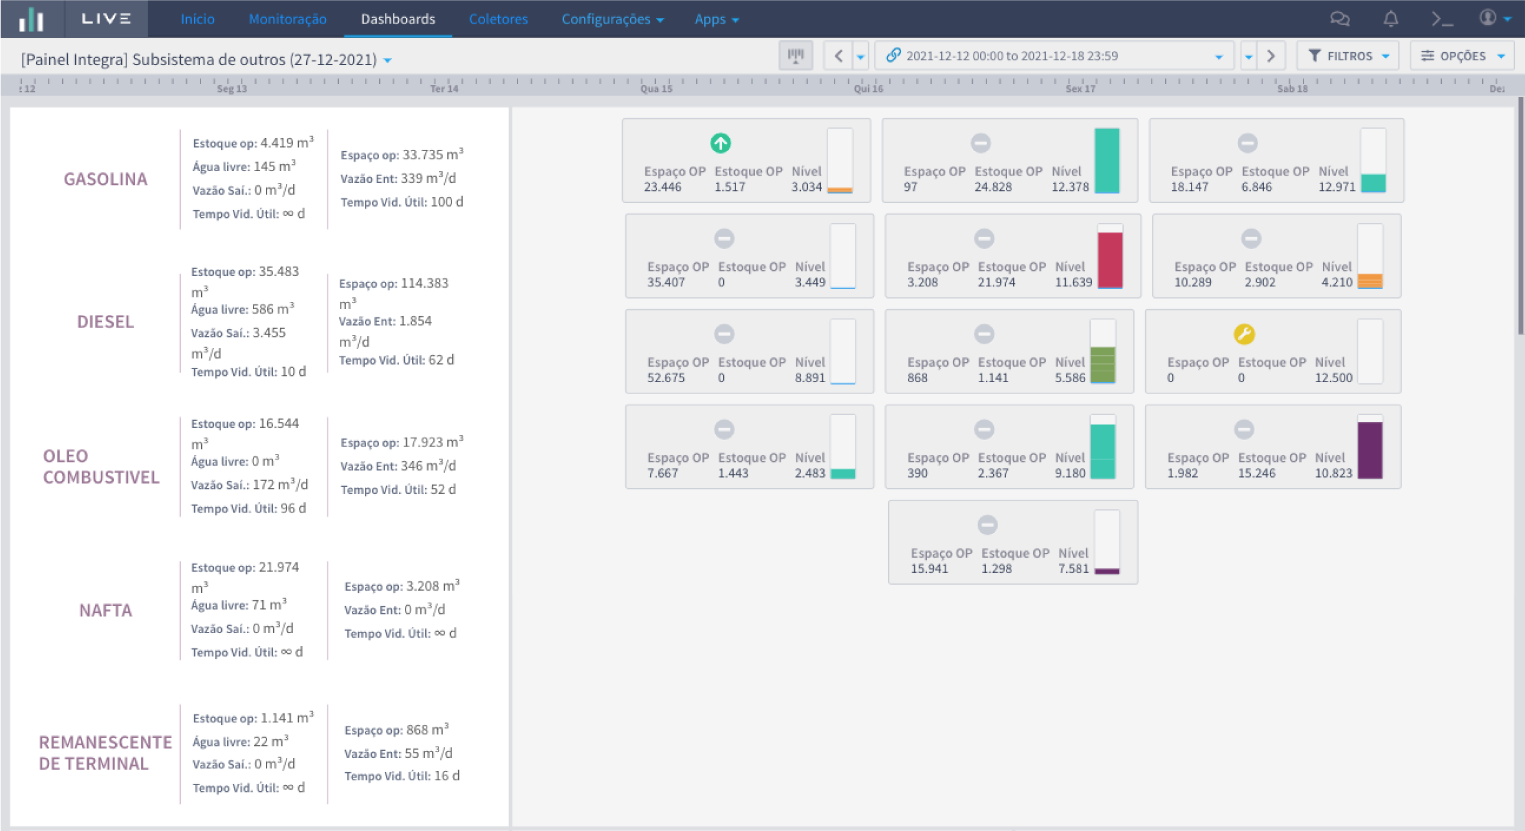
Integrated views of information
First, all operations are monitored by sensor networks installed at Transpetro's operating terminals. In this way, current systems can connect to this sensor network and obtain some relevant data, such as asset operating status and process variable data (pressure, temperature, flow, density). During the project, we questioned how to integrate this sensor network with the terminal planning and management systems and visualize this information for more than one terminal simultaneously.
Second, Planning is a process that takes place before Operations. It is precisely where the data is identified and management systems are used to know how much a terminal can pump supplying or receiving products. Most systems are still legacy systems with languages and architectures with many opportunities for improvement. How to integrate operational data with planning data?
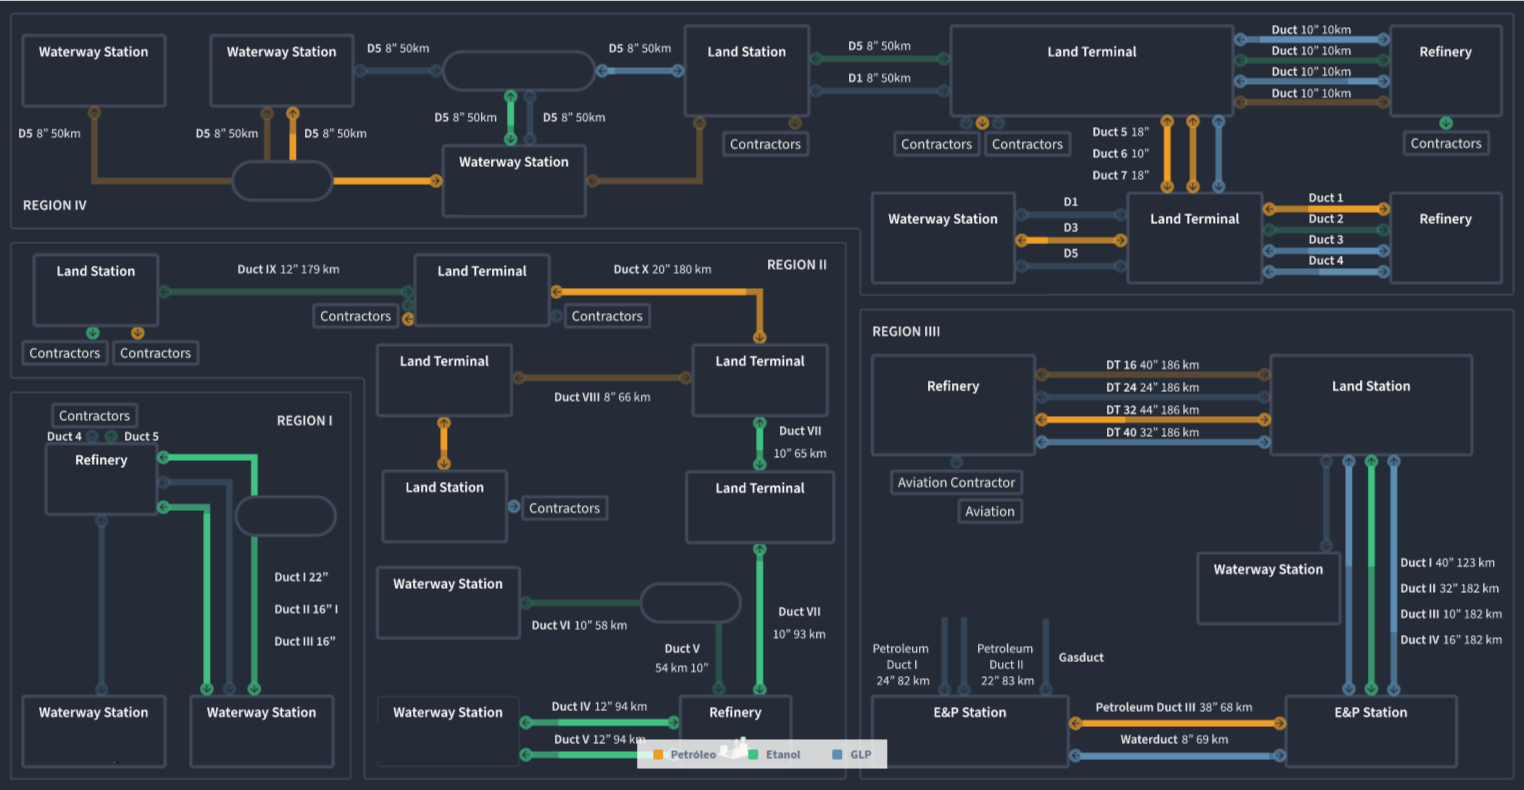
Third, the National Control and Logistics Center (CNCL) centrally monitors the company's pipeline transport operations, using state-of-the-art technology equipment. Altogether, there is more than 14 thousand km of pipelines (oil and gas pipelines) supervised 24 hours a day.
The opportunity was to find out how to create a pipeline map that can show at the same time information from pipeline sensors, types of terminals, and others, thus creating a holistic view of the pipeline network throughout Brazil.
What Intelie was able to do
With the pilot project at one of the stations, we increased information management and increased efficiency in operations management, by integrating information from sensors with information from management systems and, in that way, providing a holistic and controlled view of the operation, planning, and control of the station.
Pipeline Monitoring Solution
- Dynamic Schematic of the Station
- Primary Assets Dashboards
- Product Subsystem Dashboards
- Quality analysis results Dashboard
- Real-TIme Operations Dashboard


